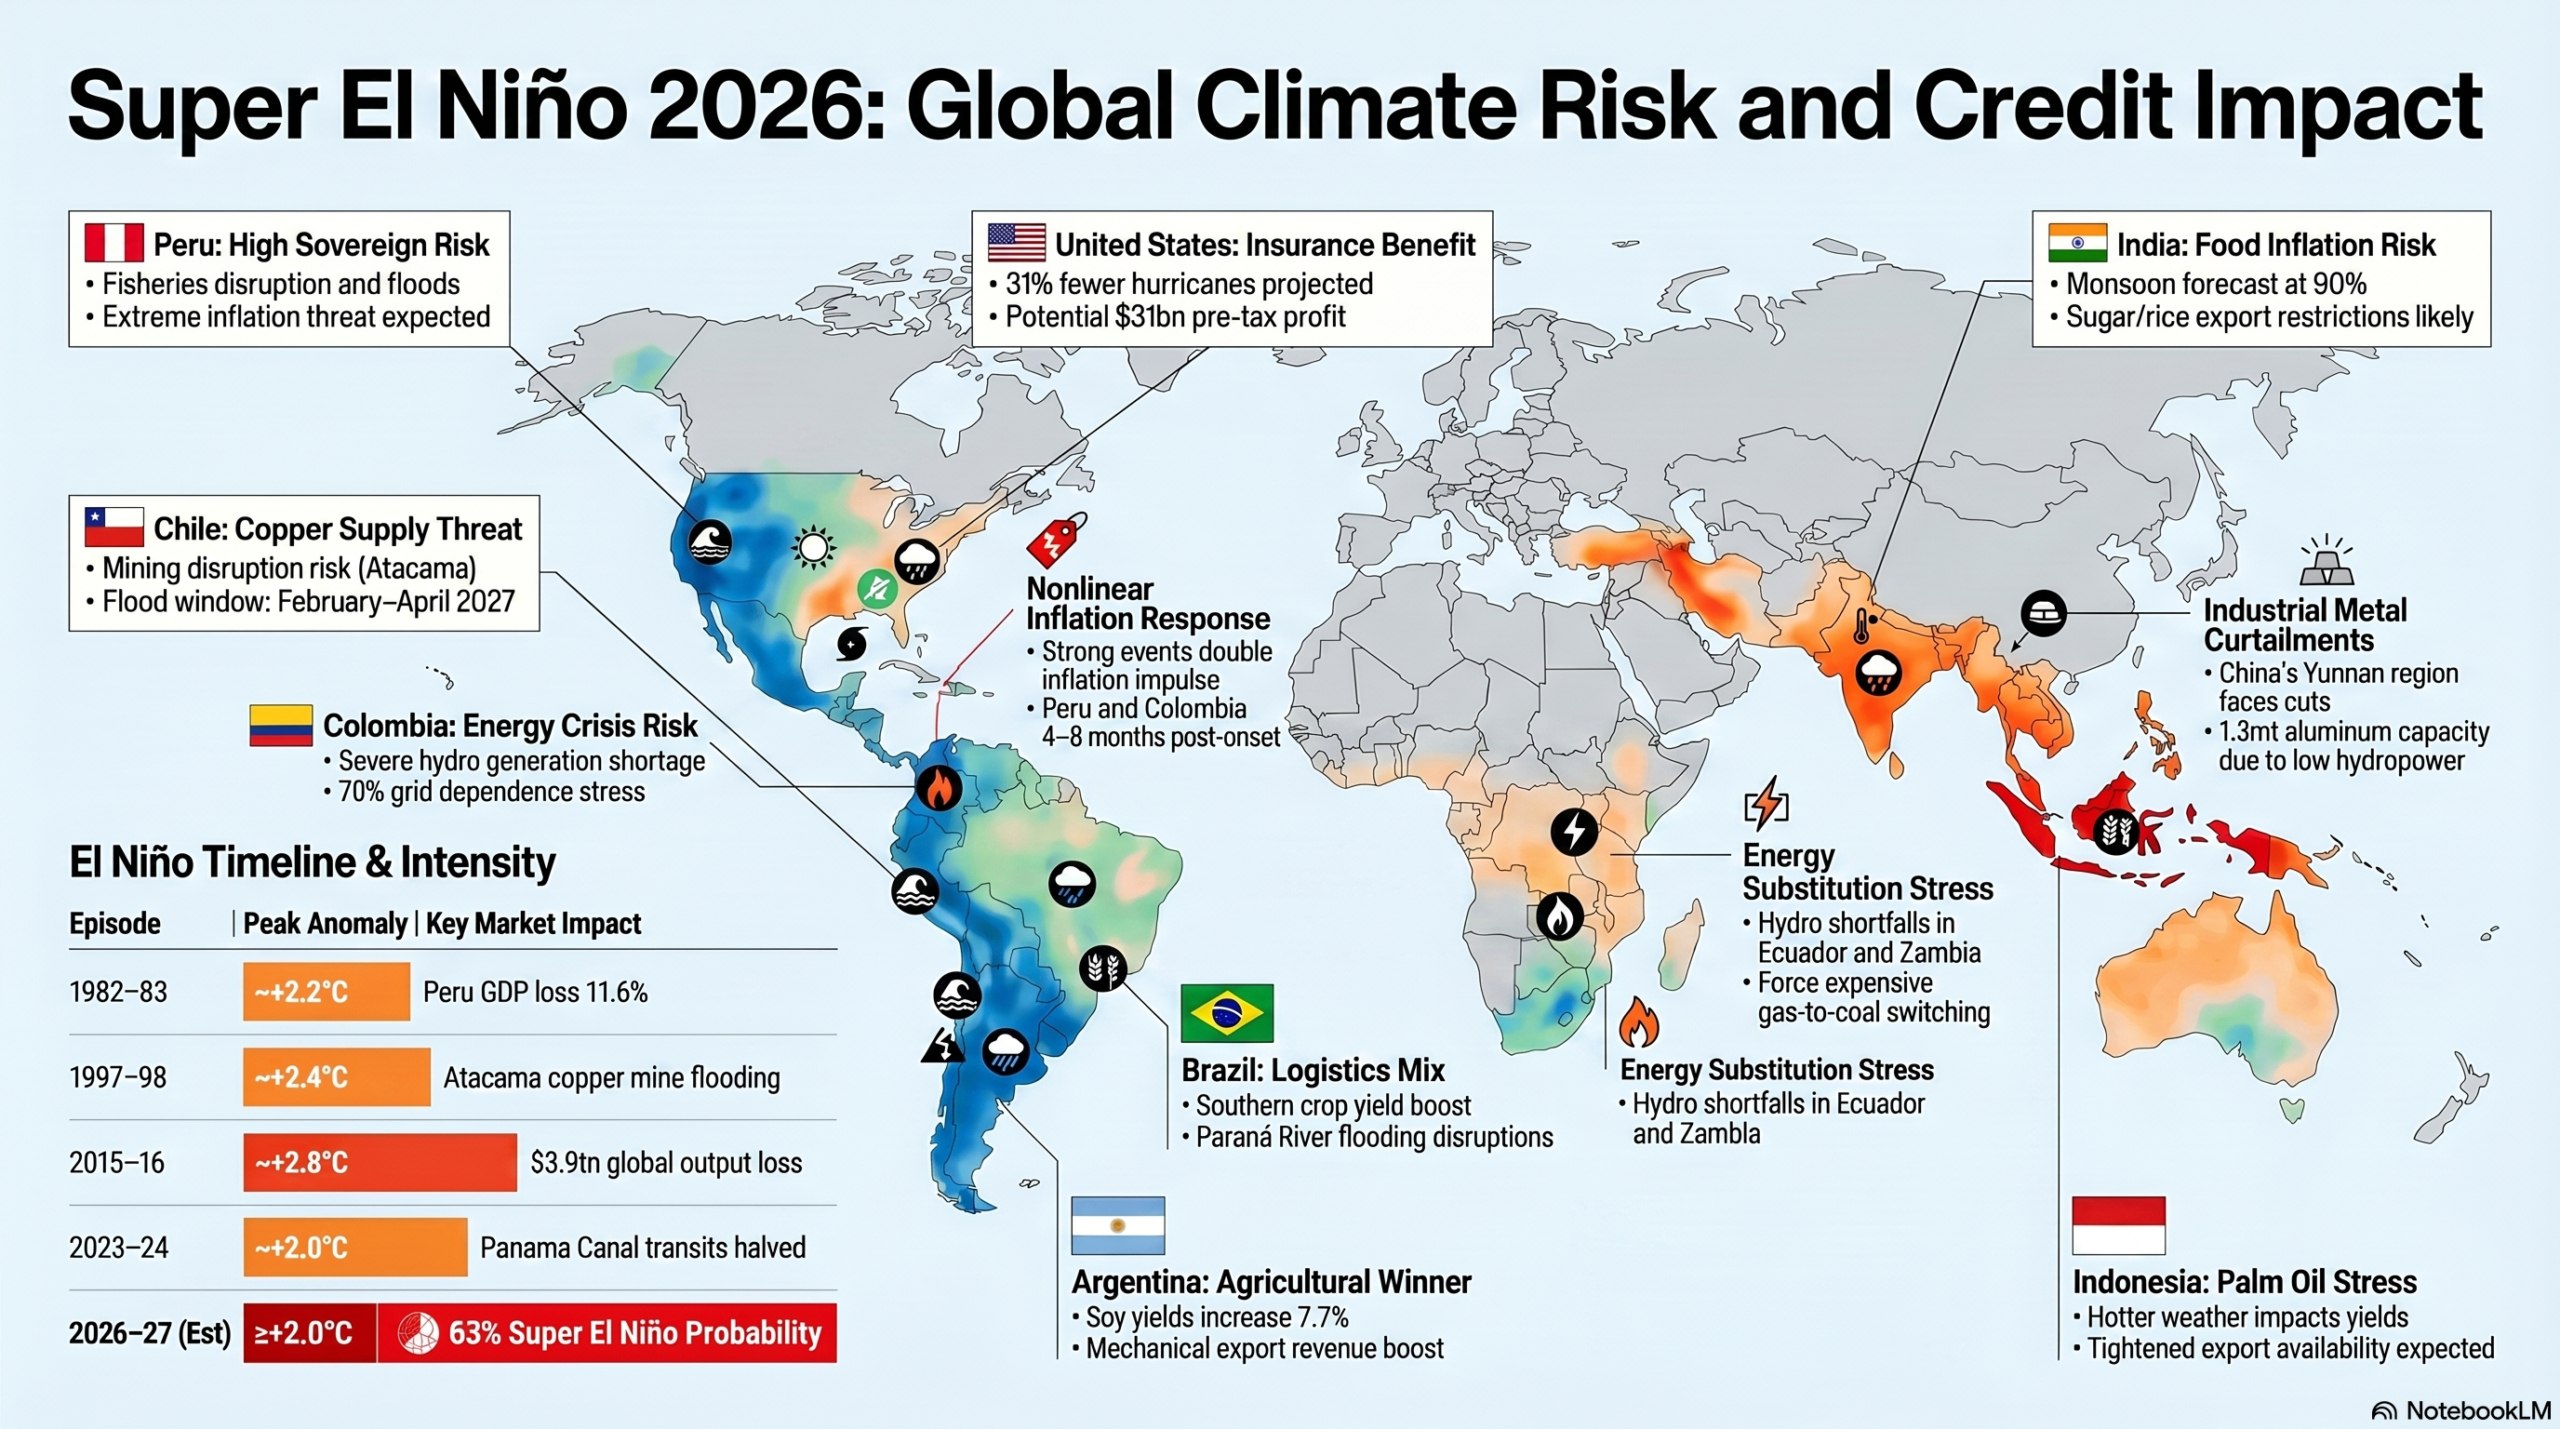
Executive Summary: NOAA – the National Oceanic and Atmospheric Administration, a U.S. scientific agency that studies and predicts changes in weather, climate, oceans, and coasts while managing marine and coastal resources – has officially declared El Niño with a 63% probability of a Super El Niño, marking one of the fastest regime shifts on record and setting up a highly nonlinear global macro shock into 2H 2026 and early 2027. The event interacts with already tight commodity markets and ongoing geopolitical disruptions, amplifying transmission through food inflation, energy systems, logistics bottlenecks, and commodity supply shocks. Emerging markets face asymmetric exposure via inflation, fiscal stress, and external balances, while select sectors benefit from price spikes and benign insurance loss dynamics. The resulting environment creates a high-dispersion credit landscape with pronounced winners and losers across sovereign and corporate risk.
Market Visualizer
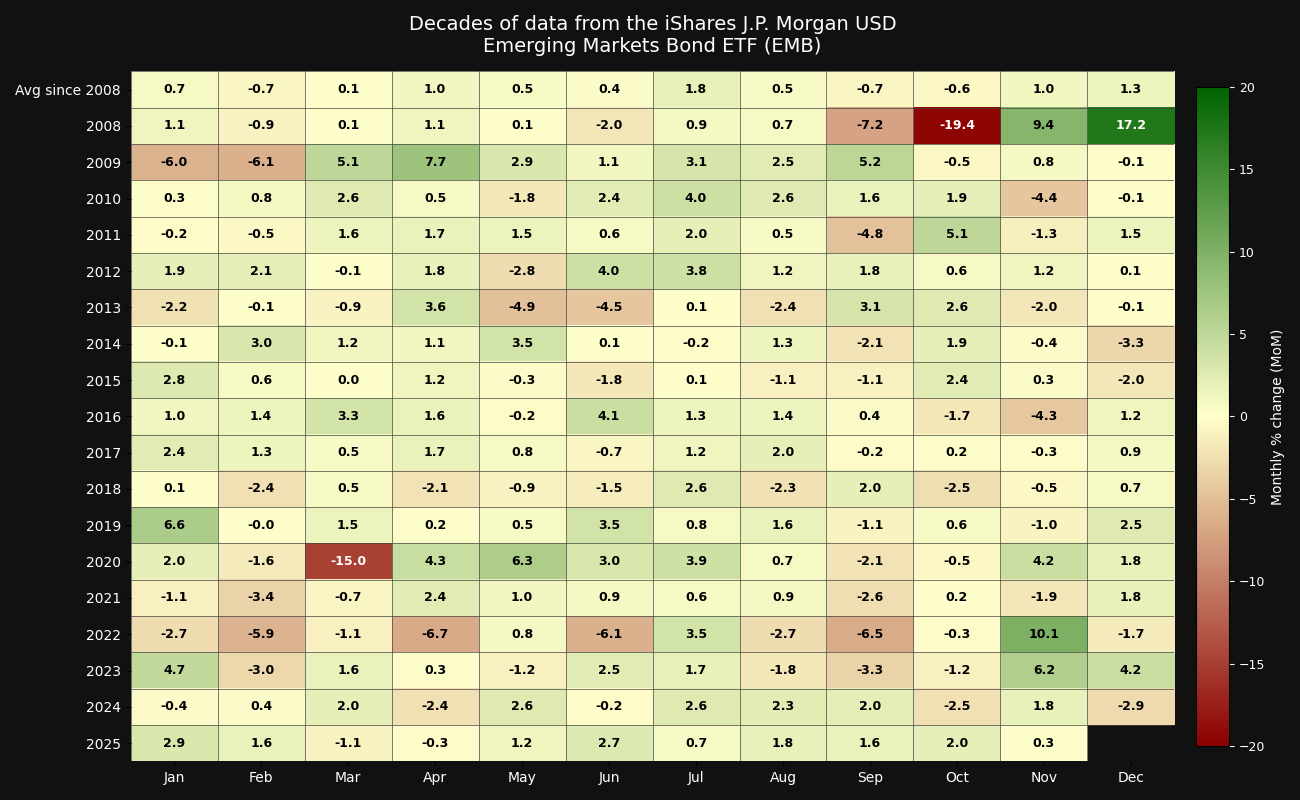
SUPER EL NIÑO: THE CLIMATE RISK TRADE
Theme Setup and Probability Skew
- Rapid regime shift: Sea surface temperatures flipped from La Niña conditions in March 2026 to El Niño by June 11, setting a record pace and signaling an aggressive thermal buildup that historically correlates with stronger downstream climate shocks.
- Super El Niño probability: NOAA assigns a 63% probability of ≥+2.0°C by NDJ 2026–27, while some sell side research forecasts a 60% probability of strong-plus events, implying elevated tail risk for severe macro and credit dislocations.
- Subsurface heat reservoir: Temperature anomalies exceeding +6°C below surface levels provide a structural driver of sustained warming, increasing persistence into 1Q 2027 and deepening economic transmission.
- Upper-tail scenario risk: Some models exceed historical intensities seen in the past 80 years, suggesting potential nonlinear impacts that surpass prior episodes such as 2015–16.
- Compounding macro backdrop: Elevated energy prices linked to Iran/Strait of Hormuz tensions increase cost-push inflation risks, reinforcing El Niño’s supply-side shock across EM economies.
Historical Precedent and Structural Differences
- Growth destruction magnitude: The 2015–16 El Niño reduced global output by an estimated $3.9tn over five years, highlighting the medium-term persistence of climate shocks beyond initial weather effects.
- Country-level losses: Peru experienced GDP losses of 6.2–11.6% during past strong events, underscoring sovereign vulnerability in directly exposed coastal economies.
- Commodity disruption track record: The 2015–16 event disrupted ~90kt of copper supply and forced ~300kt aluminium curtailments, demonstrating sensitivity in industrial metals supply chains.
- Food shock evidence: India’s monsoon decline of −13.8% in 2015–16 drove food inflation to 6.2%, illustrating transmission from weather to CPI and policy tightening risks.
- Current cycle tighter starting point: Unlike prior cycles, the 2026 copper market already faces a 300–400kt deficit, amplifying price sensitivity and credit implications from supply disruptions.
Macro Transmission Channels to Credit
- Nonlinear inflation response: Sell side models show inflation more than doubles moving from mild to strong El Niño, with peak effects lagging 4–8 months into H2 2026, creating delayed policy pressure.
- Food CPI transmission: With food comprising 10–35% of EM CPI baskets, any supply shock feeds directly into headline inflation, tightening financial conditions and pressuring sovereign credit.
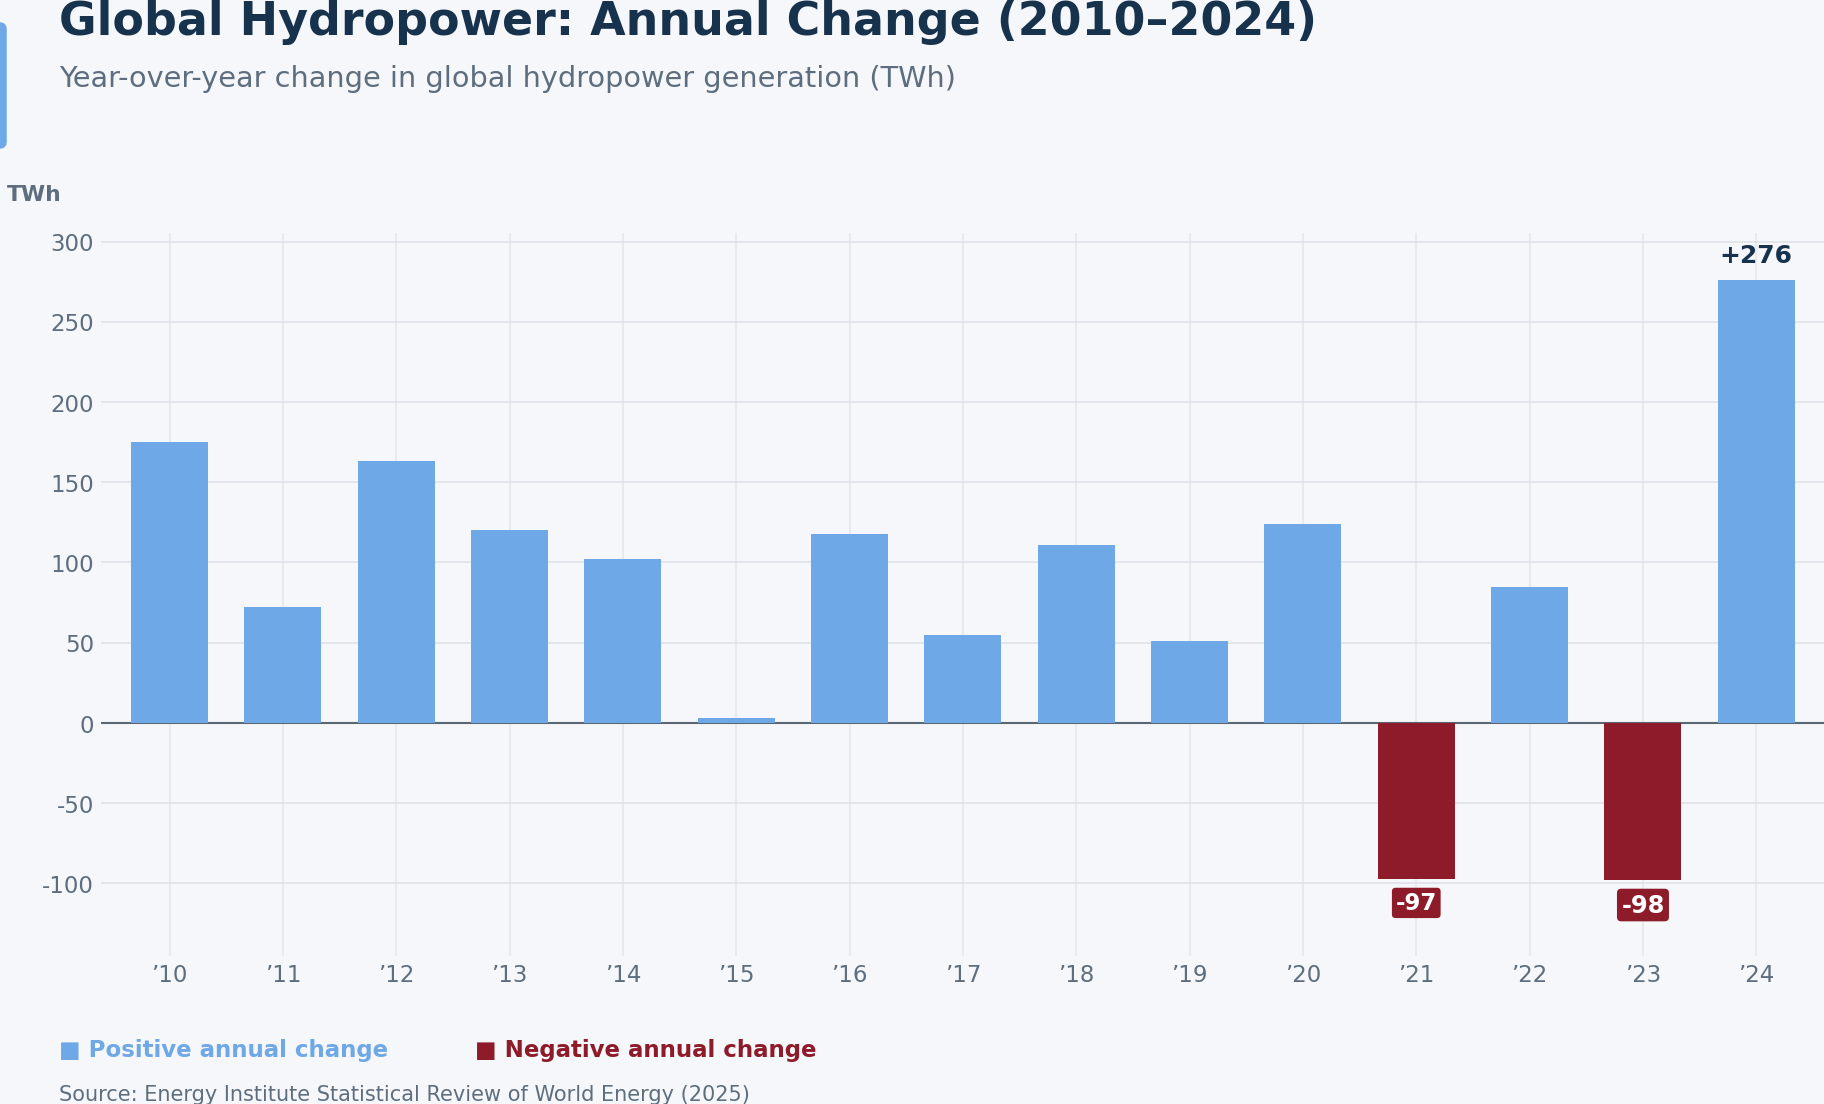
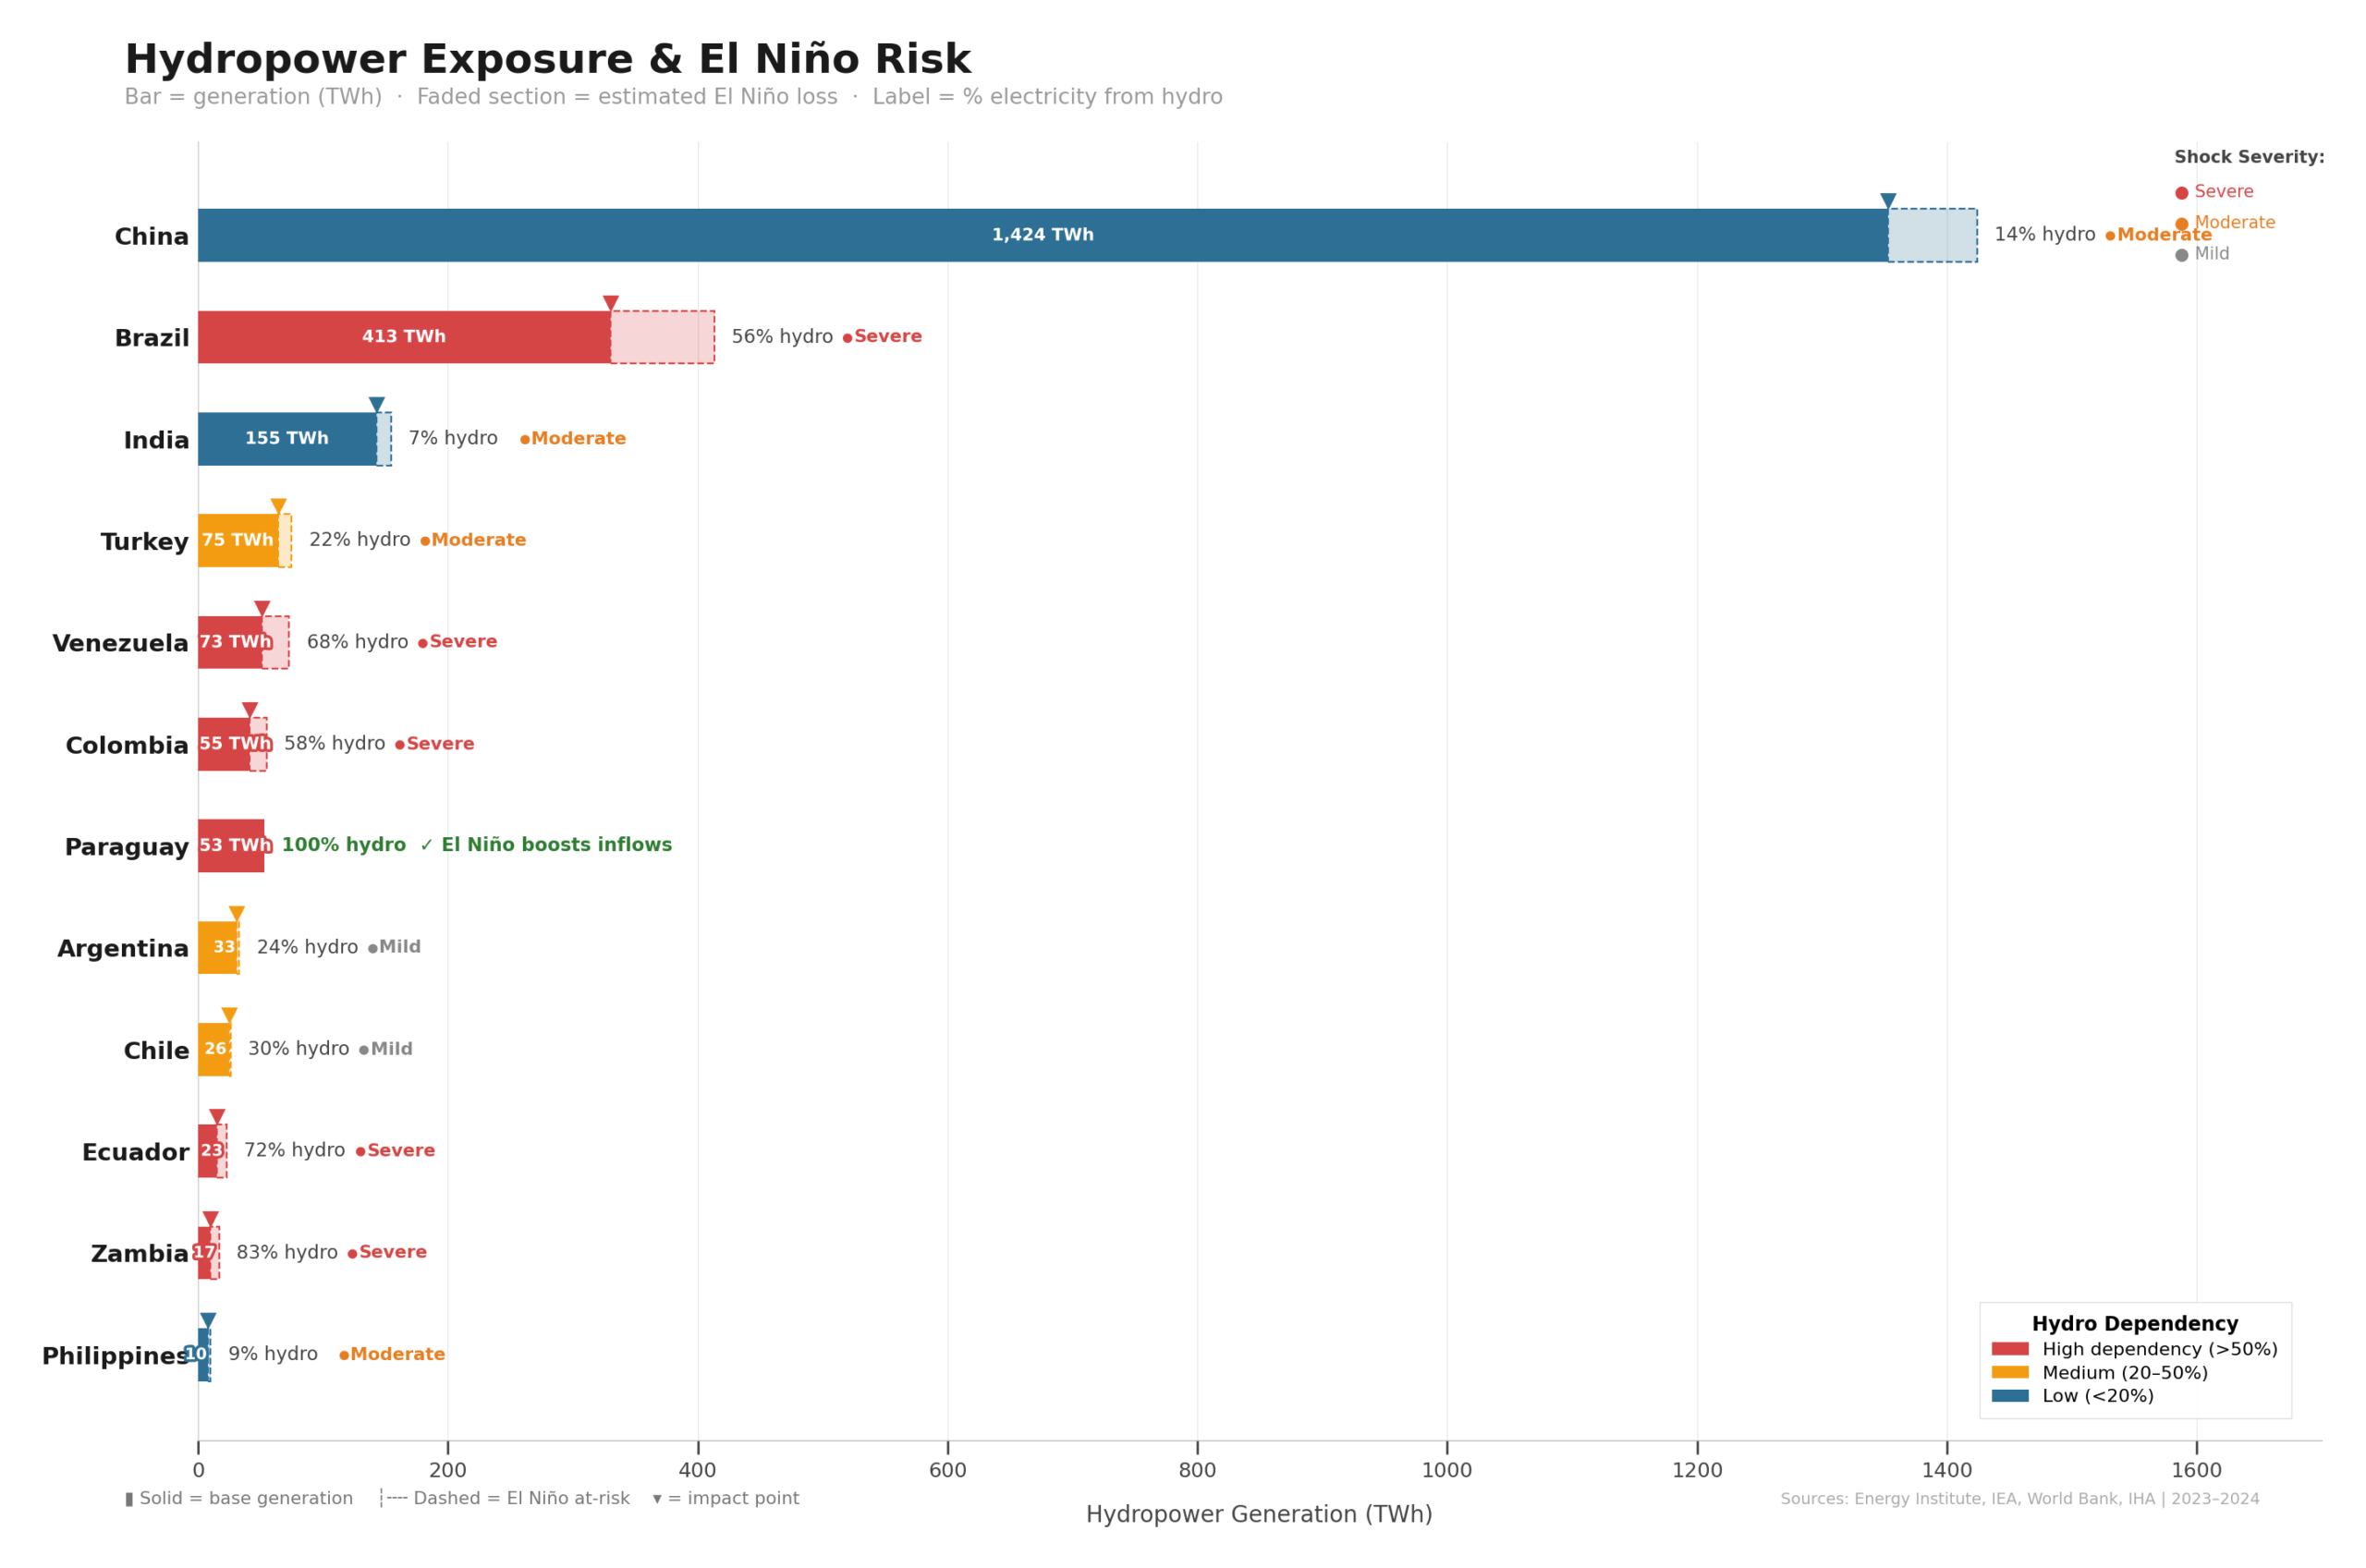
- Hydro-to-thermal switching: Drought reduces hydro output (e.g., Colombia 60–70% hydro dependence), forcing coal and LNG substitution at higher costs, weakening utility balance sheets and fiscal positions.
- Commodity price amplification: Chile’s 4.2mt copper production (17% global share) faces flood risk, where even a one-week outage (~80kt) materially tightens markets and boosts price-driven earnings volatility.
- Logistics disruption: Panama Canal throughput fell ~29% in 2024 during prior El Niño, indicating global shipping constraints that raise freight costs and delay supply chains, impacting corporate cash flows.
Sovereign Credit Differentiation
- Peru stress case: Direct ocean exposure, fisheries disruption, and historical GDP losses up to 11.6% position Peru as the highest-risk EM sovereign under a super El Niño scenario.
- India inflation risk: With an 84% probability of sub-normal monsoon, food inflation could breach the RBI’s 6% ceiling, driving fiscal slippage via INR500bn+ fertilizer subsidies.
- Colombia hydro vulnerability: Heavy reliance on hydropower combined with drought risks increases electricity prices and adds ~465bps to inflation during strong events, complicating monetary policy.
- Argentina upside skew: Soy yields improve ~+7.7% per degree of warming and maize output can rise ~6mt, supporting GDP (+0.31pp) and fiscal revenues via export taxes.
- Panama risk timing: While 2026 conditions remain strong with $5.7bn revenues, the 2027 dry season presents a key inflection point for canal revenue and sovereign balance implications.
Sectoral and Corporate Credit Impacts
- Agriculture input inflation: Cocoa prices previously exceeded $10,000/t and remain volatile, pressuring margins for processors and driving working capital expansion.
- Hydro utilities stress: EBITDA compression emerges as hydro shortfalls force thermal imports at higher marginal costs, particularly in Colombia, Ecuador, and Zambia.
- Metals upside asymmetry: Aluminium curtailments up to 1.3mt in Yunnan and 2.5mt already offline from Iran disruptions support price upside.
- Insurance earnings boost: Reduced hurricanes (−31%) and storms result in 14–20% lower global insured losses, implying $21–31bn pre-tax benefits for insurers.
- Aquaculture margin pressure: Fishmeal price spikes (~$2,500/mt) increase feed costs (40–45% of production), compressing margins for salmon producers unless offset via pricing.
Credit / Investment Implications
The Super El Niño shock is inherently nonlinear, with simultaneous supply disruptions across food, energy, and commodities amplifying inflation and compressing real incomes in EM. The asymmetric nature of exposure creates divergence, with import-dependent and hydro-reliant economies facing stress while commodity exporters and select corporates benefit. The interaction with tight commodity markets and geopolitical energy shocks increases the probability of outsized spread moves.
- Overweight commodity beneficiaries (thermal coal, aluminium, copper) where supply disruptions translate directly into EBITDA uplift of 3–17% per 10% price move.
- Underweight hydro-dependent sovereigns and utilities where drought-driven generation costs materially weaken fiscal and credit metrics.
- Position for insurance earnings upside but anticipate reinsurance pricing softening due to reduced loss environment and excess capital supply.
www.gembridgecapital.com
DISCLAIMER
This document is strictly confidential and is being provided to you for informational purposes only. It does not constitute an offer to sell or a solicitation of an offer to buy any securities or financial instruments. The information contained herein has been obtained from sources believed to be reliable but is not guaranteed as to accuracy or completeness. Opinions and estimates constitute our judgment as of the date of this material and are subject to change without notice.
AI Generation Notice: Portions of this content may have been generated or assisted by Artificial Intelligence (AI) technologies. Users should independently verify critical data points. Past performance is not indicative of future results.
Executive Summary: This week’s special focus examines the seven-decade trajectory of US-Iran relations, culminating in current tensions following Trump’s naval deployment amid Iran’s domestic protests and ongoing nuclear disputes. Understanding this historical context is critical for assessing sovereign credit risks and regional market volatility.
Market Visualizer
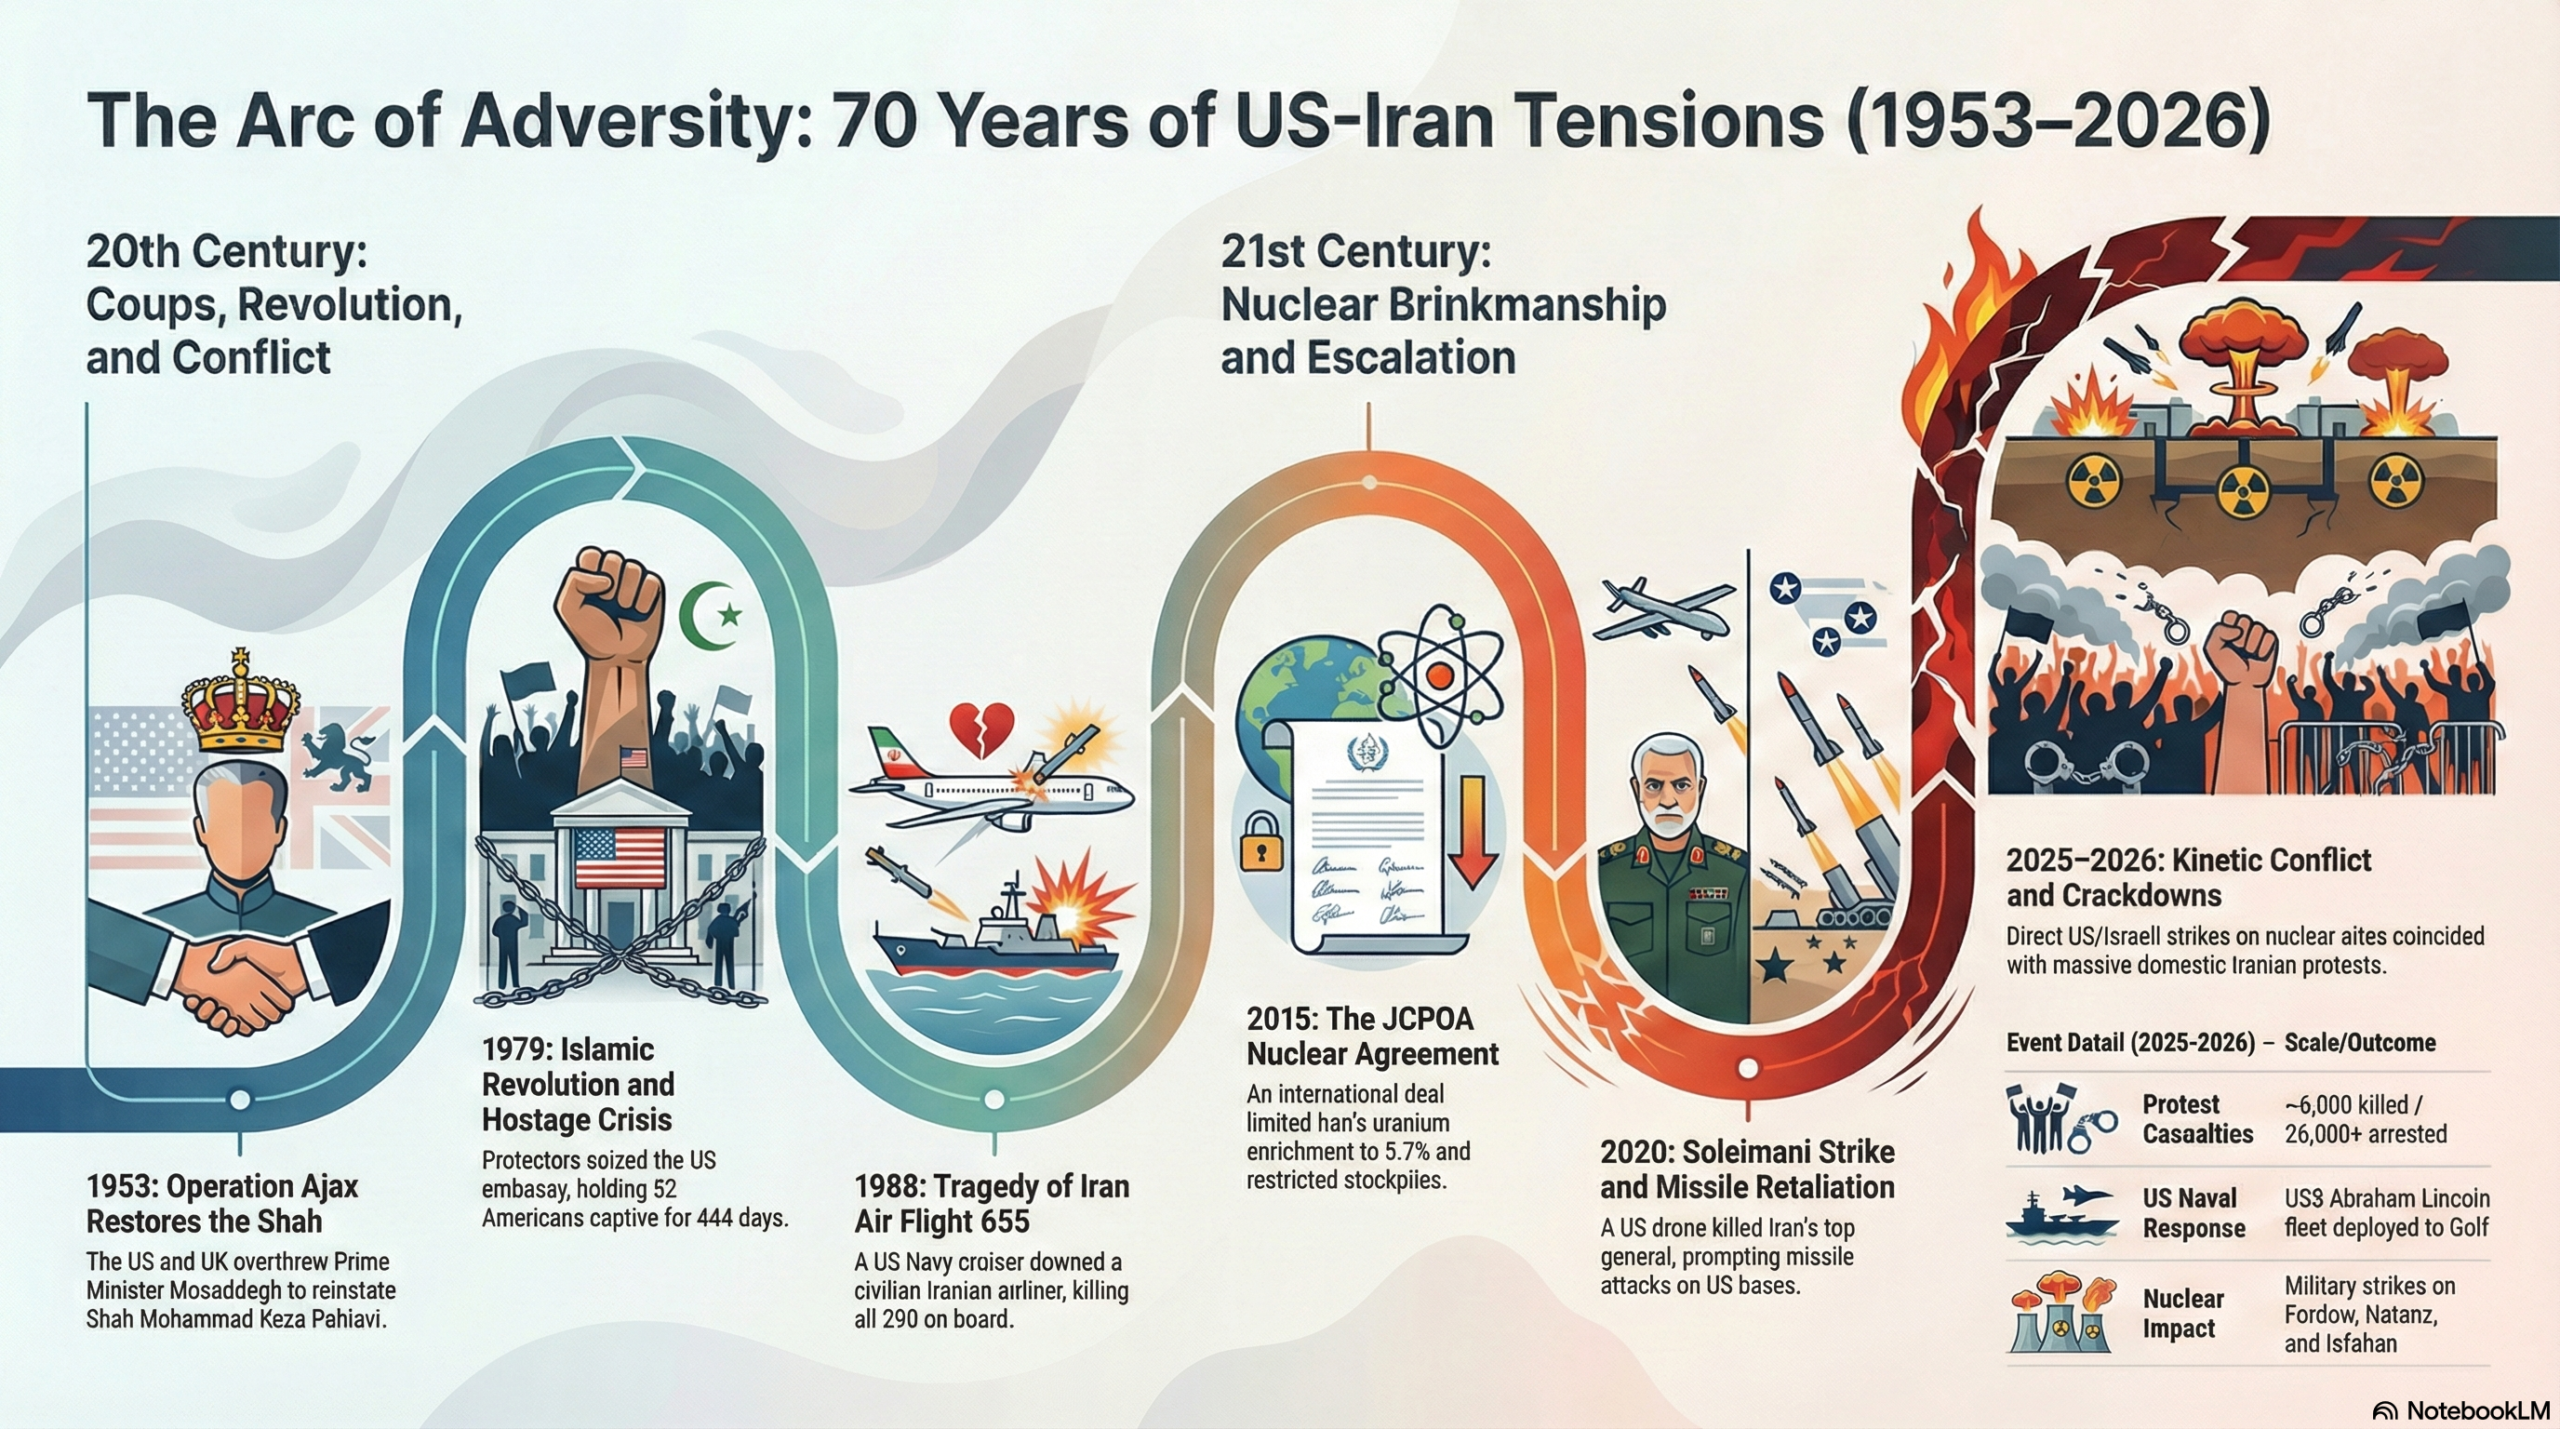
⚠️ Special Topic: US-Iran Tensions Timeline
US-Iran tensions trace back over 70 years, with granular milestones from the 1953 coup to Trump’s 2026 naval deployment amid Iran’s protests and nuclear disputes.
1950s: Coup and Early Ties
- 1951: Iran’s parliament nationalizes oil from British control, led by PM Mohammad Mosaddegh.
- 1953: US/UK Operation Ajax overthrows Mosaddegh, reinstating Shah Mohammad Reza Pahlavi.
- 1957: US signs nuclear cooperation deal under “Atoms for Peace.”
1960s-1970s: Arms and Revolution Buildup
- 1968: Both nations sign Nuclear Non-Proliferation Treaty.
- 1972: Nixon pledges unlimited conventional arms to Shah.
- 1979 Jan: Shah flees amid Islamic Revolution protests.
- 1979 Feb-Apr: Ayatollah Khomeini returns; Iran becomes Islamic Republic.
- 1979 Nov: Students seize US embassy, taking 52 hostages.
1980s: Hostage Crisis and War
- 1980 Apr: Failed US Operation Eagle Claw kills 8 servicemen; ties severed.
- 1980 Sep: Iraq invades Iran; US backs Iraq despite chemical weapons.
- 1981 Jan: Hostages released after 444 days via Algiers Accords.
- 1984: US labels Iran state terrorism sponsor.
- 1986: Iran-Contra scandal exposed.
- 1988 Jul: USS Vincennes downs Iran Air 655, killing 290.
1990s-2000s: Sanctions and Nuclear Revelations
- 1995-96: Clinton imposes oil/trade bans, Iran-Libya Sanctions Act.
- 2002 Jan: Bush’s “axis of evil” speech.
- 2002 Aug: Natanz, Arak sites revealed.
- 2003: Iran suspends enrichment, allows IAEA inspections.
- 2007: US intel says Iran halted weapons program in 2003.
- 2009: Fordow enrichment site exposed by US/UK/France.
2010s: JCPOA and Withdrawal
- 2013: Obama-Rouhani call; interim Joint Plan of Action signed.
- 2015 Jul: JCPOA limits Iran to 3.7% enrichment, 300kg stockpile.
- 2018 May: Trump withdraws, restores sanctions.
2020s: Strikes, Talks, Protests
- 2019: IRGC designated terrorist group.
- 2020 Jan: US drone kills Qasem Soleimani; Iran missiles US bases.
- 2021: Biden Vienna talks fail.
- 2023: Prisoner swap releases $6B Iranian funds.
- 2025 Feb-Jun: Trump demands new deal; US/Israel strike Fordow/Natanz/Isfahan; Iran hits Qatar base.
- 2025 Dec: Protests erupt over currency collapse, demanding Khamenei ouster.
- 2026 Jan: Crackdown kills ~6,000, arrests 26,000+; Trump deploys USS Abraham Lincoln fleet to Gulf, threatens action.
Credit Market Implications
The current US-Iran escalation introduces notable risks to regional sovereign and corporate credits in emerging markets. Investors should closely track:
- Oil price volatility and its effects on Gulf sovereign spreads.
- Prospective sanctions expansions impacting regional banks and trade finance.
- Safe-haven flows into higher-quality EM credit.
- Contagion to other USD-denominated Middle East sovereign credits if conflict broadens.
Binary Event Risk
Potentially a binary event in the coming weeks: US military action against Iran (risking selloff) or Iran agreeing to a new nuclear treaty (risking rally).
www.gembridgecapital.com
DISCLAIMER
This document is strictly confidential and is being provided to you for informational purposes only. It does not constitute an offer to sell or a solicitation of an offer to buy any securities or financial instruments. The information contained herein has been obtained from sources believed to be reliable but is not guaranteed as to accuracy or completeness. Opinions and estimates constitute our judgment as of the date of this material and are subject to change without notice.
AI Generation Notice: Portions of this content may have been generated or assisted by Artificial Intelligence (AI) technologies. Users should independently verify critical data points. Past performance is not indicative of future results.
2026 Strategy
AI-led insights into emerging market credit
The global investment landscape for 2026 is defined by a transition into a regime of high dispersion, characterized by structural technological disruption and geopolitical fragmentation. While inflationary shocks have receded, the divergence between proactive emerging markets (EM) and those in systemic debt distress creates a fertile environment for alpha generation. This AI-generated analysis integrates corrections to election cycles, commodity valuations, and the renewed U.S. emphasis on tariffs and bilateral bargaining.
Watch: AI-Generated Market Analysis
1. Illustrative 2026 Political Risk Calendar
Note: Election dates reflect official commissions as of January 11, 2026.
Key Insight: Sovereign Spread Volatility
Brazil and Colombia exhibit the highest beta to political headlines. Brazilian USD spreads have historically widened by 100-200 bps during contested cycles where fiscal rules are debated.
2. Sovereign Liability Management and the Restructuring Cycle
The “Sweet Spot” for tactical opportunity lies in B and CCC-rated sovereigns that completed restructurings between 2023-2025.
🇺🇦 Ukraine
Concluded a major restructuring of $20.5bn in bonds (Sept 2024) with a ~37% principal haircut. Prices reached post-restructuring highs of 70+ in late 2025 on peace optimism.
🇱🇰 Sri Lanka
Completed restructuring in Dec 2024 with a 35-40% NPV reduction and 98% participation.
🇦🇷 Argentina
Under Milei, the U.S. Treasury established a support facility reported up to $20B, with discussions of expansion toward $40B as policy shifts accelerate.
SDG Pressure Point
Per OECD projections, approximately 92 countries spent more on external debt service in 2024 than on non-climate Sustainable Development Goal (SDG) investments.
3. The Structural Shift: EV Transition and Tech Debt
EV Market Adoption
Global plug-in sales reached nearly 22 million units in 2025 (~25% market share). China notably exceeded a 50% EV sales share in late 2025.
The Oracle Proxy: Tech Debt Risk
Tech sector bond supply remains high. Oracle (ORCL) is the primary risk proxy for AI-driven leverage:
Total Debt
Ballooned to $131.7 billion as of the Nov 30, 2025, quarter due to massive AI CapEx.
Credit Risk
Barclays has flagged a potential downgrade to BBB- and cash exhaustion risk by Nov 2026 if revenue does not scale to match current infrastructure spending.
4. Revised Commodity Bull Cycle (2025-2026)
Projections reflect 2025 realized peaks and updated January 2026 house forecasts.
5. Geopolitical Spheres: The “Trumpian” Influence
🇻🇪 Venezuela
Following Operation Absolute Resolve (January 3, 2026) and the removal of Maduro, sovereign and PDVSA bonds surged from distressed single digits to the 35-45 cent range as markets priced in a restructuring path.
🇨🇴 Colombia: BRI Alignment
Formally joined the Belt and Road Initiative (BRI) in May 2025, deepening ties with China amidst a diplomatic crisis with the U.S.
🇧🇷 Brazil: Tariff Complexity
Faces a 50% total tariff (stacking a 40% reciprocal duty) imposed by the U.S. in mid-2025. However, Annex I carve-outs (modified Nov 2025) exempt roughly 44% of export volume, including iron ore, crude oil, and civil aviation.
6. Regional Real Estate and Corporate Resilience
Hong Kong Property
Shifting to a “volume-led” recovery. Developers face 27,000 unsold units, but rental yields for small units (Class A) have stabilized near 3.7%.
Brazil Corporates
Despite sovereign fiscal rigidity, JBS, Vale, and Itaú show robust fundamentals. Approximately 60% of Brazilian corporate debt remains Selic-linked, making 2026 rate cuts a primary catalyst for credit rotation.
Investment Thesis
The high dispersion environment of 2026 favors active managers with deep regional expertise. Focus areas include:
- Post-restructuring sovereigns with improving fundamentals (Ukraine, Sri Lanka, Argentina)
- Corporate credit in EM countries with high policy rates entering easing cycles (Brazil, Colombia)
- Commodity-linked exposures benefiting from structural deficits and geopolitical premiums
- Technology sector credit with careful attention to refinancing risk and AI capex sustainability
References & Data Sources
- Thailand Election: https://en.wikipedia.org/wiki/2026_Thai_general_election
- Bangladesh Election: https://ddnews.gov.in/en/bangladesh-to-hold-national-election-on-feb-12-first-since-sheikh-hasinas-ouster/
- Ethiopia Election: https://en.wikipedia.org/wiki/2026_Ethiopian_general_election
- Ukraine Restructuring: https://www.whitecase.com/insight-alert/ukraine-concludes-historic-restructuring-us205-billion-international-bonds
- OECD SDG Report: https://www.oecd.org/en/publications/2025/02/global-outlook-on-financing-for-sustainable-development-2025_6748f647.html
- Oracle Debt (SEC): https://www.sec.gov/Archives/edgar/data/1341439/000119312525200095/orcl-20250831.htm
- Venezuela Bond Rally: https://www.bnnbloomberg.ca/business/2026/01/06/venezuela-debt-rally-belies-complex-creditor-web-political-quagmire/
- Brazil Tariff Annex I: https://www.ey.com/en_gl/technical/tax-alerts/us-imposes-additional-tariffs-on-brazilian-origin-goods
- HSBC Gold Forecast: https://www.kitco.com/news/article/2026-01-08/gold-price-could-reach-5050oz-h1-2026-h2-correction-could-be-deeper-hsbc
- Hong Kong Property: https://news.gov.hk/eng/2025/07/20250725/20250725_142505_825.html
Gembridge Capital
Singapore-based emerging markets credit hedge fund specializing in sovereign and corporate debt strategies.
Research
Periodic AI-powered report of special topic on emerging market credit
Disclaimer: This report is generated primarily by artificial intelligence and may contain errors, inaccuracies, or outdated information. Users should exercise extreme caution and independently verify all data and analysis before making any decisions. This content is for informational purposes only and does not constitute investment advice. The information contained herein is based on sources believed to be reliable, but Gembridge Capital makes no representation or warranty as to its accuracy or completeness. Past performance is not indicative of future results. Investing in emerging market securities involves substantial risk, including the risk of loss of principal. Investors should conduct their own due diligence and consult with qualified financial advisors before making any investment decisions.