


The Santa Effect?
- Home
- Topical Issues
- The Santa Effect?

EM Credit Strategy | AI Reporting Desk
The December Paradox: Structural Seasonality in EM Sovereign Credit
Executive Summary
The prevailing market narrative regarding Emerging Market (EM) credit suggests that December is a “soft market”—defined by widening bid-ask spreads and a cessation of price discovery. However, a forensic analysis of nearly two decades of data from the iShares J.P. Morgan USD Emerging Markets Bond ETF (EMB) indicates this hypothesis is inconsistent with historical volume and volatility patterns [1, 2, 3]. The data reveals that while liquidity often thins, this scarcity frequently amplifies, rather than dampens, directional volatility [13].
1. Liquidity Analysis: Crisis vs. Normalcy
Historical volume analysis challenges the assumption of a dormant December market. While the “Ski Lodge” theory suggests a universal decline in activity, the data reveals a bifurcated liquidity landscape depending on the macro environment [15]. In “Normal Years” (such as 2019, 2022, 2023, and 2024), trading volume does indeed contract by approximately 10-40% relative to the January-November average [17].

However, during stress events, the “holiday” effect is negated. In 2008, following the global financial crisis, December volume spiked 116%. Similarly, during the 2014 oil shock, volume increased by 49%, and during the 2018 Fed tightening scare, it rose by 53%. This indicates that during regime changes, liquidity is available but comes at the cost of widened spreads due to high turnover.
2. Volatility Skew: The Cost of Liquidity
The relationship between market depth and price action in December exhibits high convexity. Quantitative analysis shows that while average liquidity depth decreases by roughly 18% (48M shares vs. a 59M average), the resulting returns are approximately 3x higher than the annual monthly average (1.28% vs 0.36%). This inverse relationship aligns with broader academic findings on liquidity constraints [12, 14].

This “thinner market” dynamic means price discovery must travel further to find equilibrium. In 2014, this resulted in a price crash where the ETF opened at 66.87 and fell to a low of 62.08—a decline of over 7% in a single month.
3. “Window Dressing”: A Conditional Phenomenon
The data suggests that “Window Dressing”—the practice of bidding up assets at year-end—is highly correlated with the prevailing trend rather than serving as an independent catalyst [4, 6]. In bull markets, momentum tends to accelerate; in bear markets, it fails to materialize [5].

As shown in Figure 3, the divergence is stark. In positive momentum years like 2023, December delivered a +4.2% return. Conversely, in years characterized by fundamental stress, such as 2014 and 2022, prices collapsed. This decline is likely exacerbated by tax-loss harvesting rather than window dressing, as investors sell losing positions to offset gains [8, 9, 11].
4. Long-Term Trajectory
Despite seasonal volatility, the long-term trend of the asset class remains constructive. The EMB ETF has recovered from a Global Financial Crisis low of $32.23 to reach an all-time high of $96.15 in November 2025 [1, 3].

Analytical Observations
Based on the statistical review of the 2007-2025 dataset, the following structural patterns emerge:
- Volume Inversion: While November typically exhibits higher volume than December in the post-2016 era, this trend inverts during crisis years [16].
- The January Effect Correlation: Data indicates a zero-sum relationship between December and January returns. Strong Decembers are often followed by flat or negative Januarys, while weak Decembers often precede January rebounds [18, 19].
5. Historical Performance Matrix
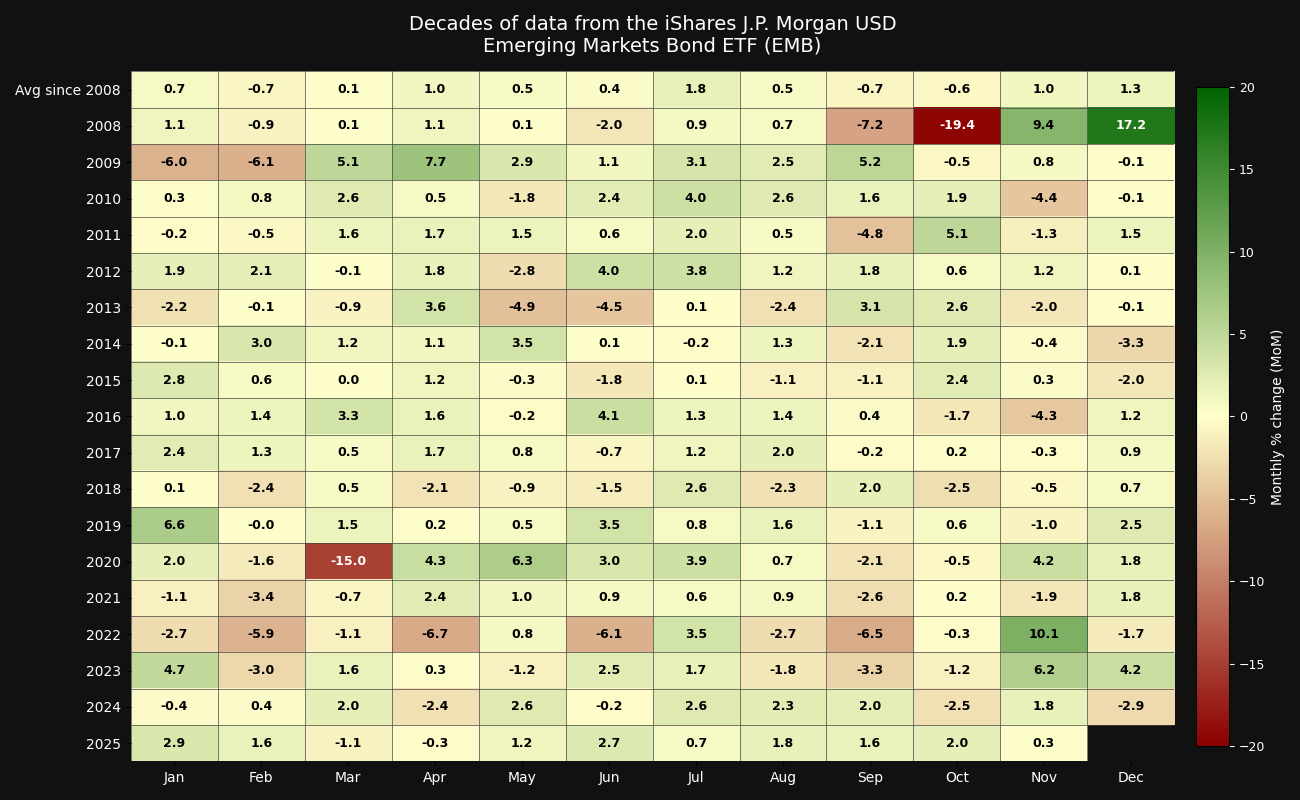
The heatmap below provides a granular visualization of the month-over-month percentage change for the EMB ETF over the past decades. This matrix highlights the seasonal clustering of volatility, particularly showcasing how December returns swing violently during crisis years (e.g., the +17.2% rebound in 2008 versus the -3.3% drop in 2014).
References
- [1] iShares EMB Official Page: ishares.com/us/products/239572
- [2] Yahoo Finance EMB Data: finance.yahoo.com/quote/EMB/
- [3] Bloomberg EMB Quote: bloomberg.com/quote/EMB:US
- [4] “Portfolios in disguise? Window dressing in bond fund holdings” (ScienceDirect, 2011): sciencedirect.com
- [5] “Window Dressing in Bond Mutual Funds” (ResearchGate, 2006): researchgate.net
- [6] Nasdaq Window Dressing Definition: nasdaq.com/glossary/w/window-dressing
- [7] The Balance – Window Dressing Explanation: thebalancemoney.com
- [8] Breckinridge Capital – “Tax-Loss Harvesting in Fixed Income Portfolios”: breckinridge.com
- [9] BlackRock – “Tax-loss harvesting with bond ETFs”: blackrock.com
- [10] PIMCO – “Easing the Pain of Gains” (Oct 2025): pimco.com
- [11] Hartford Funds – “Tax-Loss Harvesting: A Potential Boon for Bond Investors” (Mar 2025): hartfordfunds.com
- [12] “Market liquidity and volatility: Does economic policy uncertainty matter?” (PLOS One, 2024): journals.plos.org
- [13] CME Group – “Examining the relationship between equity volatility and liquidity”: cmegroup.com
- [14] “Liquidity and Volatility” (Academic Paper – Drechsler, Moreira, Savov): nyu.edu
- [15] Russell Investments – “The holiday trading effect” (Nov 2025): russellinvestments.com
- [16] “December doldrums, investor distraction…” (ScienceDirect, 2024): sciencedirect.com
- [17] QuantifiedStrategies – “The Holiday Effect in Stock Markets” (2024): quantifiedstrategies.com
- [18] LSEG – “Is the January effect in US fixed income a myth or a market reality?” (2025): lseg.com
- [19] Interactive Brokers – “How The January Effect Has Evolved” (2024): interactivebrokers.com
- [20] Invesco – “Does the January effect matter for stock performance?”: invesco.com
AI Methodology & Risk Statement
This document is primarily generated by an artificial intelligence (AI) system for informational purposes. While Gembridge Capital utilizes advanced models to synthesize and analyze market data, AI systems are susceptible to “hallucinations”—the generation of plausible but factually incorrect or misleading information. Users should be aware that the analysis herein may contain unverified assertions or errors. This report serves as an automated market monitor and should not be relied upon as a primary basis for investment decisions without independent verification.
Gembridge Capital Management
Important Disclosures: The data presented is derived from historical analysis of the iShares J.P. Morgan USD Emerging Markets Bond ETF (EMB). This report does not constitute financial advice, a recommendation to buy or sell any securities, or a solicitation of any offer. Gembridge Capital makes no representation or warranty of any kind, express, implied or statutory regarding this document or any information contained or referred to in the document. Past performance is not indicative of comparable future results. All statistics cited are based on the provided dataset spanning 2007-2025.
© 2025 Gembridge Capital. All rights reserved.